Numerical Experiments homepage
pc |
go to the PC directory |
cd samples/conv-slab |
go to the conv-slab sample |
ipython -pylab |
start a ipython shell with the matplotlib library |
var=pc.read_var() |
read the current var.dat file located in data/proc0; returns an object with the entire f array as well as some handy constants. Note that because python is C-indexed instead of fortran-indexed, and matplotlib assumes [y,x] ordering for 2D plotting, the f array returned is in the opposite order from how it is in pencil: var.f.shape will return (nvar,nz,ny,nx). |
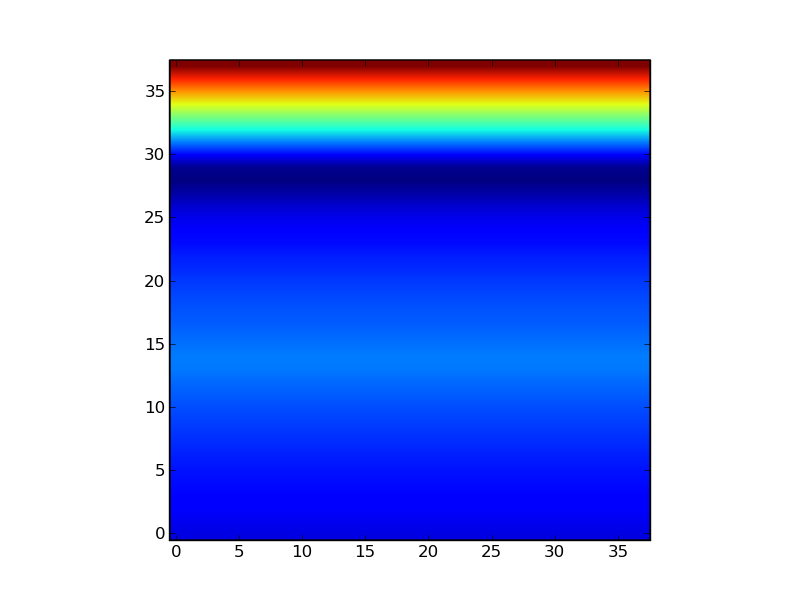
imshow(var.ss[:,3,:], origin='lower') |
plot the entropy snapshot in the plane (x, z) |
You will normally obtain this figure:

Numerical Experiments homepage