Numerical Experiments homepage
pc |
go to the PC directory |
cd samples/conv-slab |
go to the conv-slab sample |
ipython -pylab |
start a ipython shell with the matplotlib library |
pc.read_ts() |
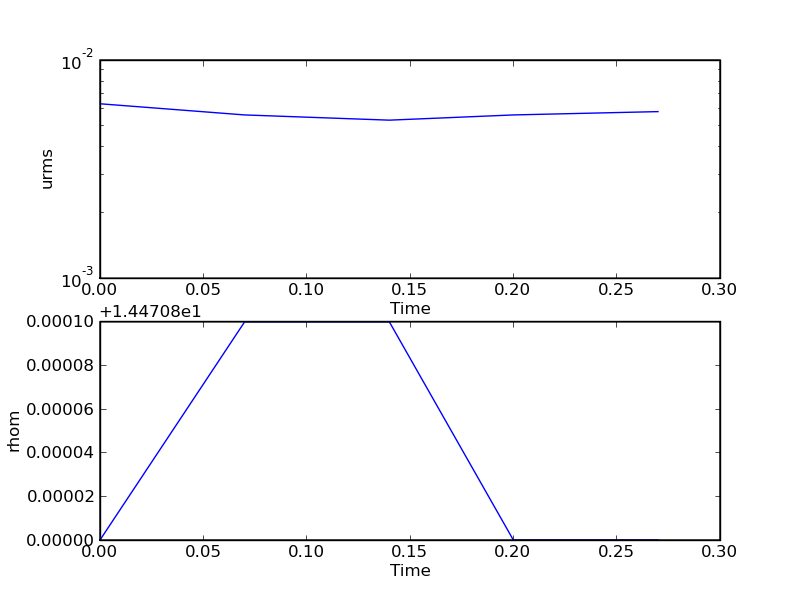
read the data/time_series.dat file and plot the results |
You will normally obtain this figure:

Numerical Experiments homepage